Typhoons are natural disasters capable of causing severe destruction worldwide, while simultaneously serving as crucial sources of freshwater. Taking Taiwan as an example, an average of three to four typhoons affect the island annually, contributing a substantial proportion to the yearly water supply. During the severe drought of 2020–2021, Taiwan experienced its first year without a typhoon landfall in 56 years, further underscoring the heavy dependence of Taiwan’s water resources on typhoon-induced rainfall. However, while excessive typhoon rainfall can easily trigger floods, landslides, and infrastructure damage, insufficient rainfall leads to water shortages. This dilemma is exacerbated by the growing uncertainties brought about by climate change. Therefore, investigating typhoon rainfall amounts across different climate scenarios is an essential task for future disaster mitigation and water resource management.
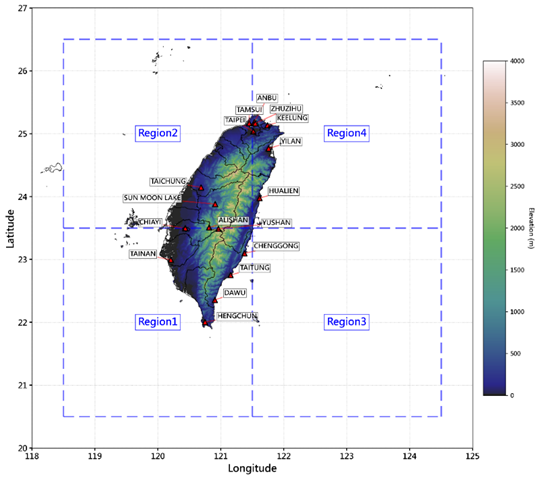
This study develops a two-stage Bayesian regression model to predict the 6-hour cumulative rainfall of typhoons. The model incorporates a Logistic Regression model to predict the probability of rainfall occurrence, alongside a Gamma Generalized Linear Model (Gamma-GLM) to predict rainfall intensity. Key variables selected for this model include typhoon central pressure, typhoon wind speed, moving direction (turning angle), distance to the station, and station wind speed. These features are combined with the state from the previous time step (6 hours prior, Lag-1) for modeling, and the model parameters are estimated using the Markov Chain Monte Carlo (MCMC) method. To account for regional variability and reduce model uncertainty, the area around Taiwan is divided into four spatial regions for separate training and prediction (as illustrated in the figure above). The model is initially developed and validated using historical typhoon data. Subsequently, by integrating synthetic typhoon data generated from a statistical typhoon model, this two-stage Bayesian regression model is applied to three distinct climate periods (1995–2014, 2041–2060, and 2081–2100) for rainfall prediction, thereby assessing the variations in Taiwan’s typhoon rainfall across different periods under future climate change scenarios.
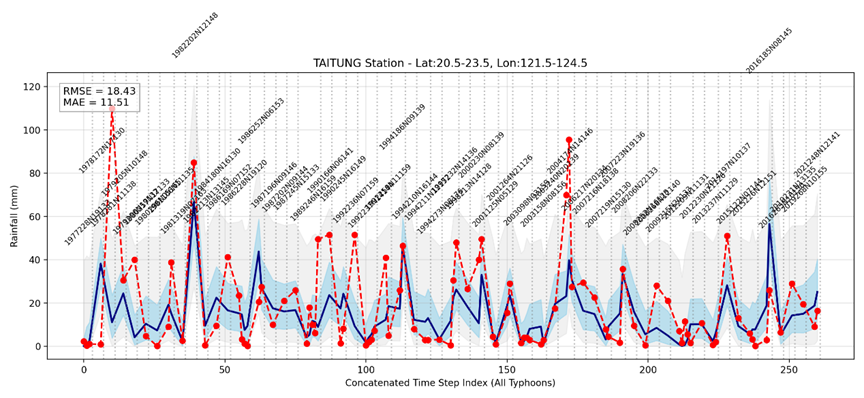
The figure below shows the validation results of the continuous 6-hour cumulative rainfall sequence for the Taitung station in Region 3 (red line: observed values; blue line: predicted median; blue shading: 25%–75% prediction interval; gray shading: 5%–95% prediction interval). Although the predicted median does not perfectly align with all observed peak values, the model still effectively captures the overall trend of rainfall variations. The vast majority of the observed values fall within the 90% prediction interval, indicating that the model’s prediction bias is maintained within an acceptable and stable range.
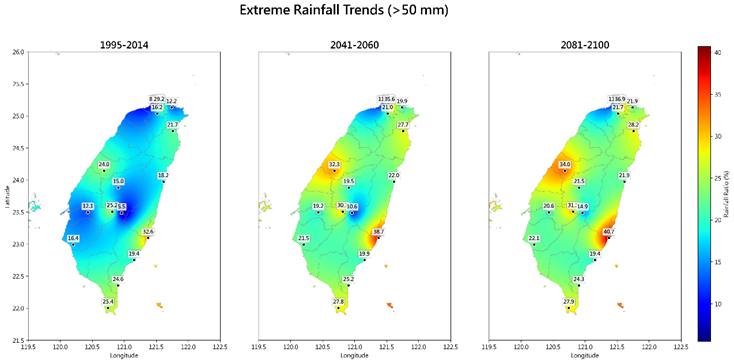
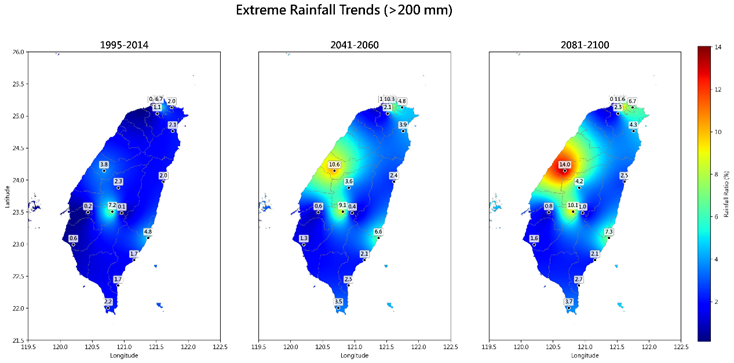
The figure below illustrates the spatial distribution of extreme rainfall ratios across three climate periods. The numerical values and color gradients in the maps represent the “rainfall ratio,” which is defined as the proportion of rainfall events exceeding a specified threshold relative to the total number of rainfall events at each station. Under the extreme rainfall thresholds (6-hour cumulative rainfall > 50 mm and > 200 mm), the distribution maps reveal an overall upward trend in extreme rainfall frequency from the historical baseline (1995–2014) to the mid-century (2041–2060) and the late-century (2081–2100). Specifically, short-term extreme rainfall exhibits a larger increase from the historical baseline to the mid-century, whereas the rate of increase becomes relatively more gradual from the mid-century to the late-century scenario.